
Silk — Internal Process Monitor
Silk — Internal Process Monitor
Client
CIAL Dun & Bradstreet
Year
2020
Role
Lead Product Designer
Key Contributions
Research, UX/UI, Prototyping, Stakeholder & Developer Collaboration
60M+
Latin American companies in the database the scrapers feed
1,000+
Scrapers monitored across the platform
Challenge
One team, one system, two people who needed completely opposite things from it.
CIAL Dun & Bradstreet runs hundreds of data scrapers that feed the database behind their credit and risk products, more than 60 million Latin American companies. Before Silk, checking on those scrapers meant opening each one by hand. No shared view, no health signal, no way to see the state of the system without doing the work of looking.
And two very different people were stuck in the same tooling. Developers needed to get in deep, logs, run schedules, failure states, the ability to step in at process level. Analysts needed the opposite, a clear read on whether data was flowing and where the gaps were. The tool asked each of them to do the other's job.
The Decision
I stopped trying to serve both people in one view and built two surfaces over one truth.
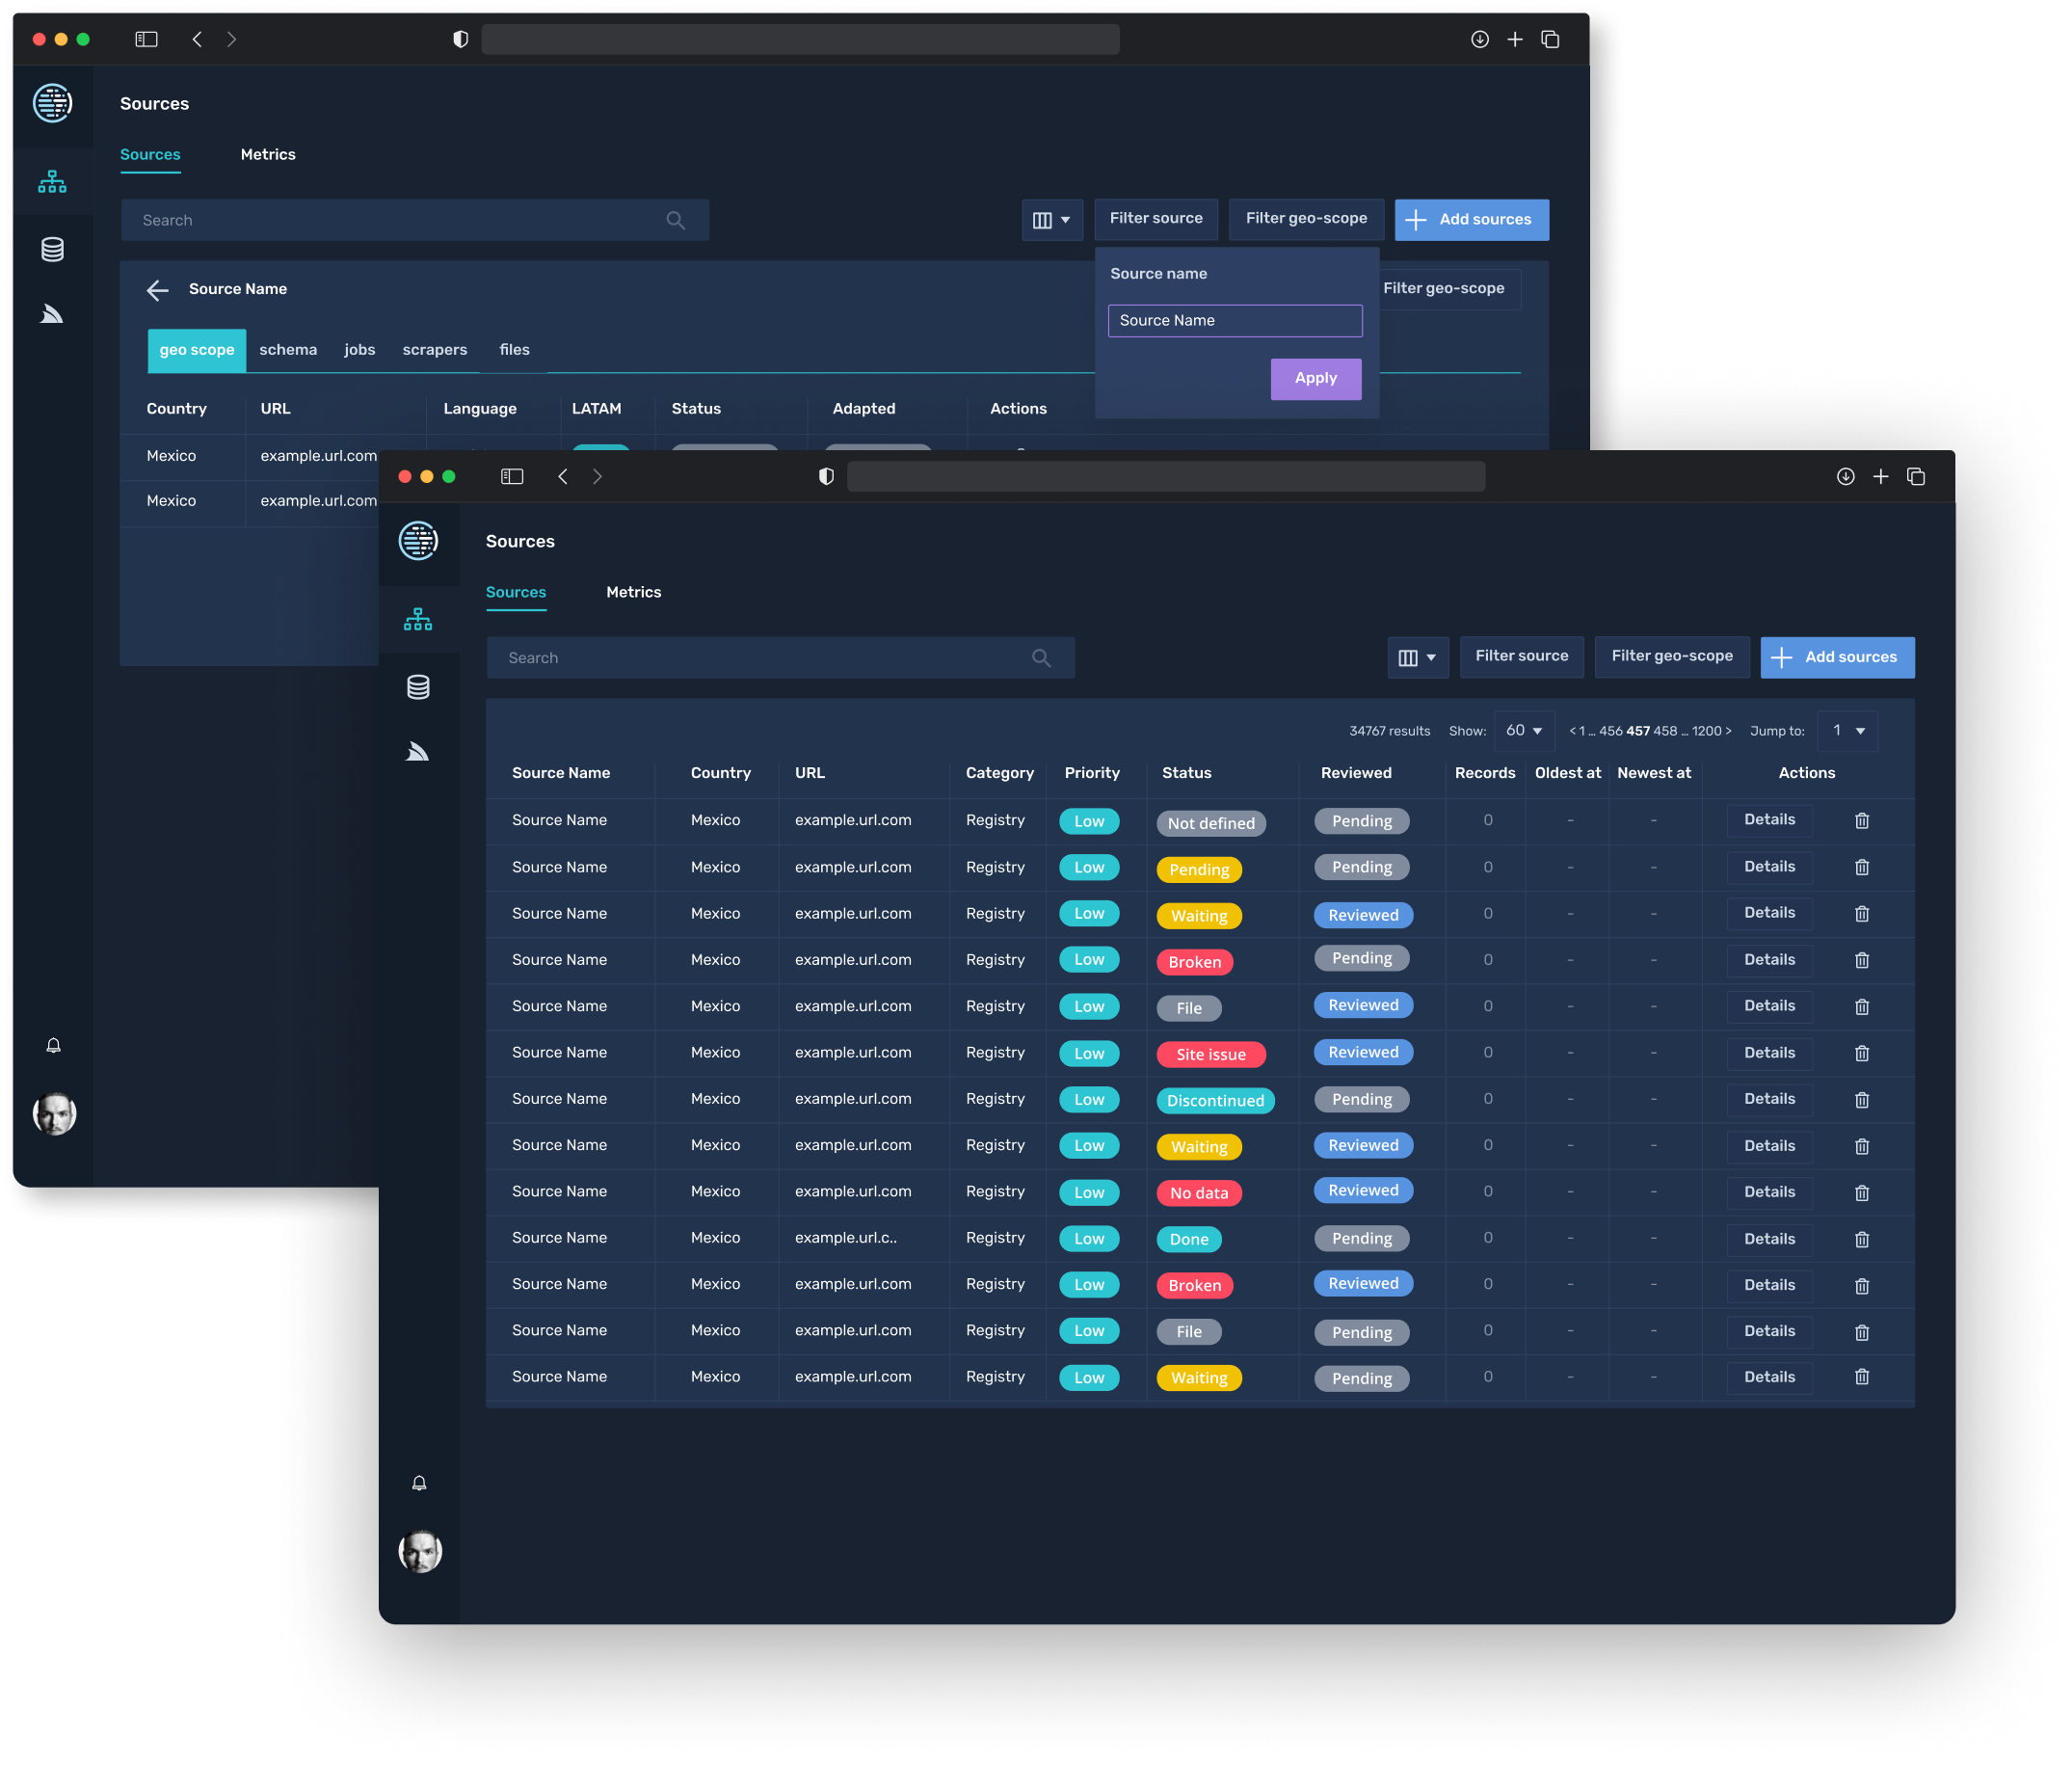
Silk was never a features problem. It was a cognitive load problem. So instead of one compromise interface, I designed one data layer with two surfaces on top, each sized to a different job.
Every screen maps to one of two modes: developer depth or analyst overview. The role-based permissions are not a security feature bolted on afterwards, they are the structure of that decision. What you see is what your job actually needs you to do with the data.
Discovery
Monitoring was manual, one scraper at a time, and nobody had a shared word for what was wrong.
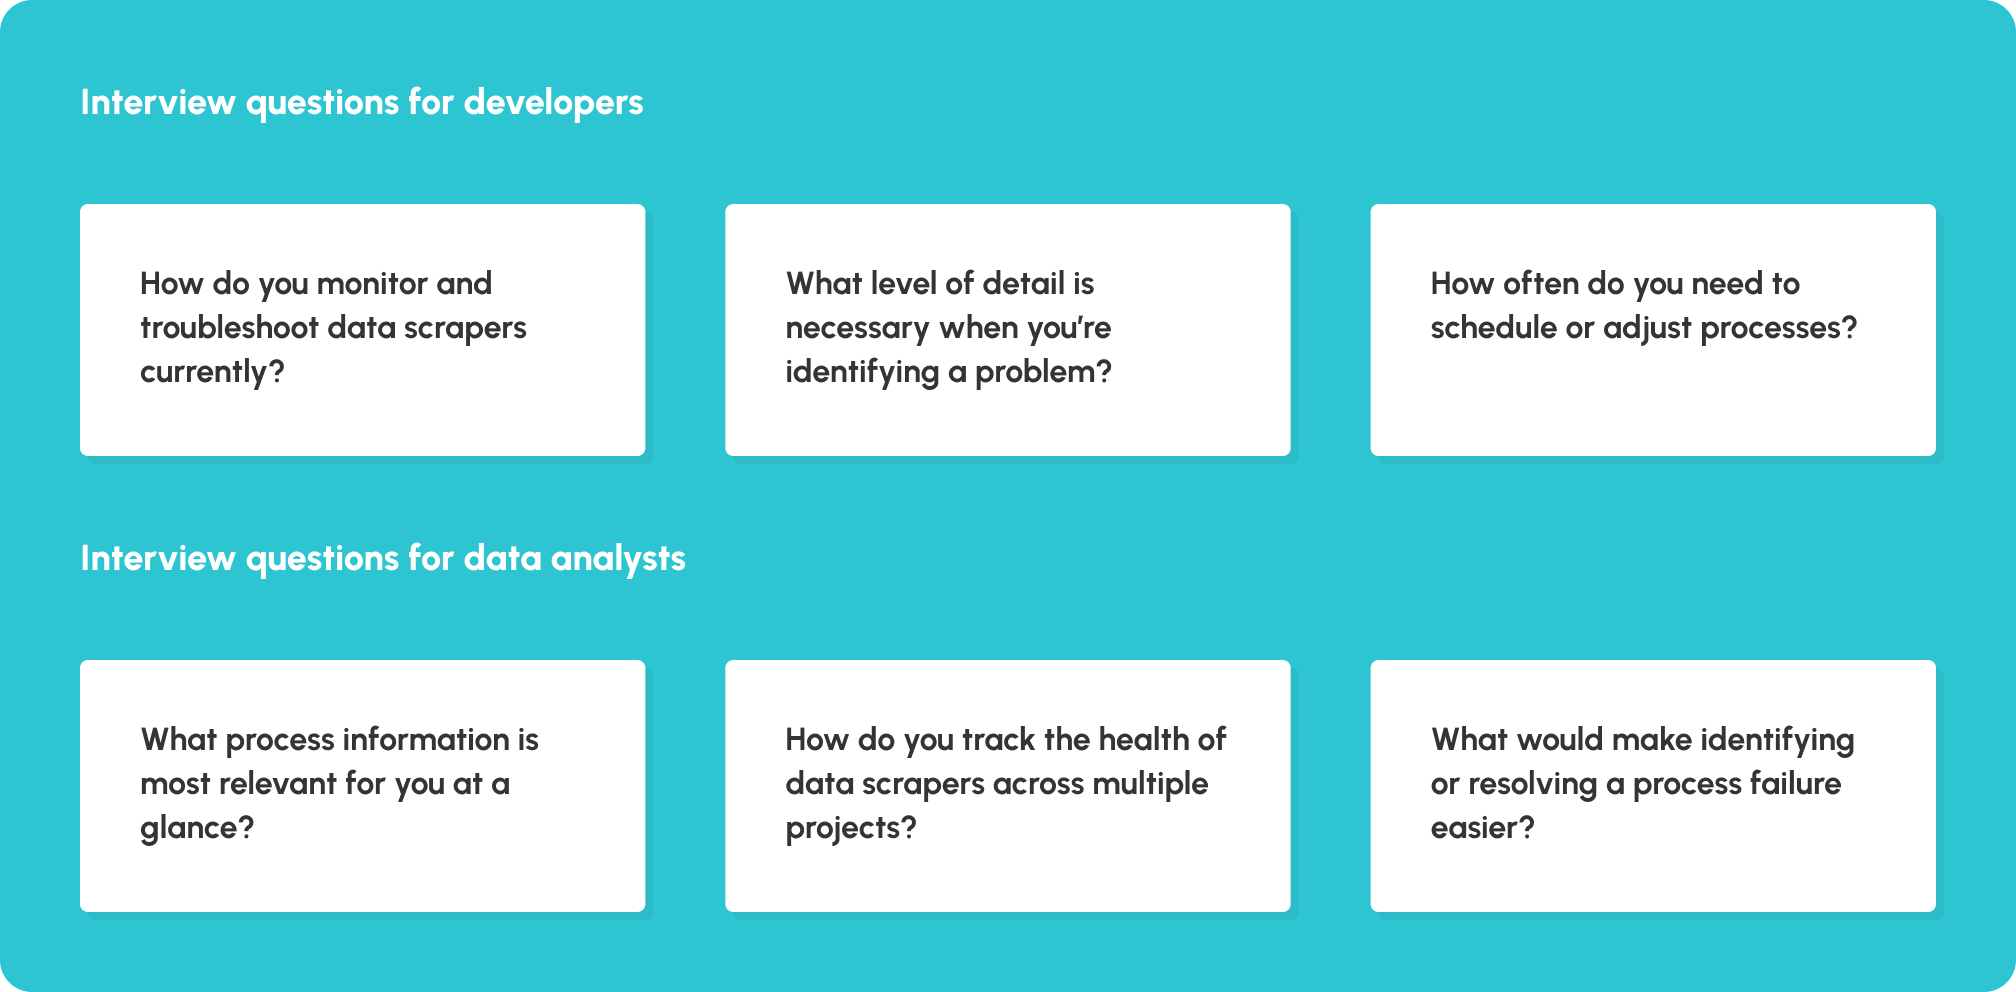
I ran sessions with the developers and analysts who worked with the scrapers every day. Three things came through clearly.
Checking was sequential. People opened scrapers one by one to find failures, so system health was invisible until someone went looking for it. The team also had no shared language for status, developers described failures in terms analysts could not act on, analysts described gaps developers could not locate without logs. And the two groups wanted flexibility in opposite directions: developers wanted more detail, analysts wanted less noise.
The System
Search gets you to the right process fast, then two views split by who is reading.
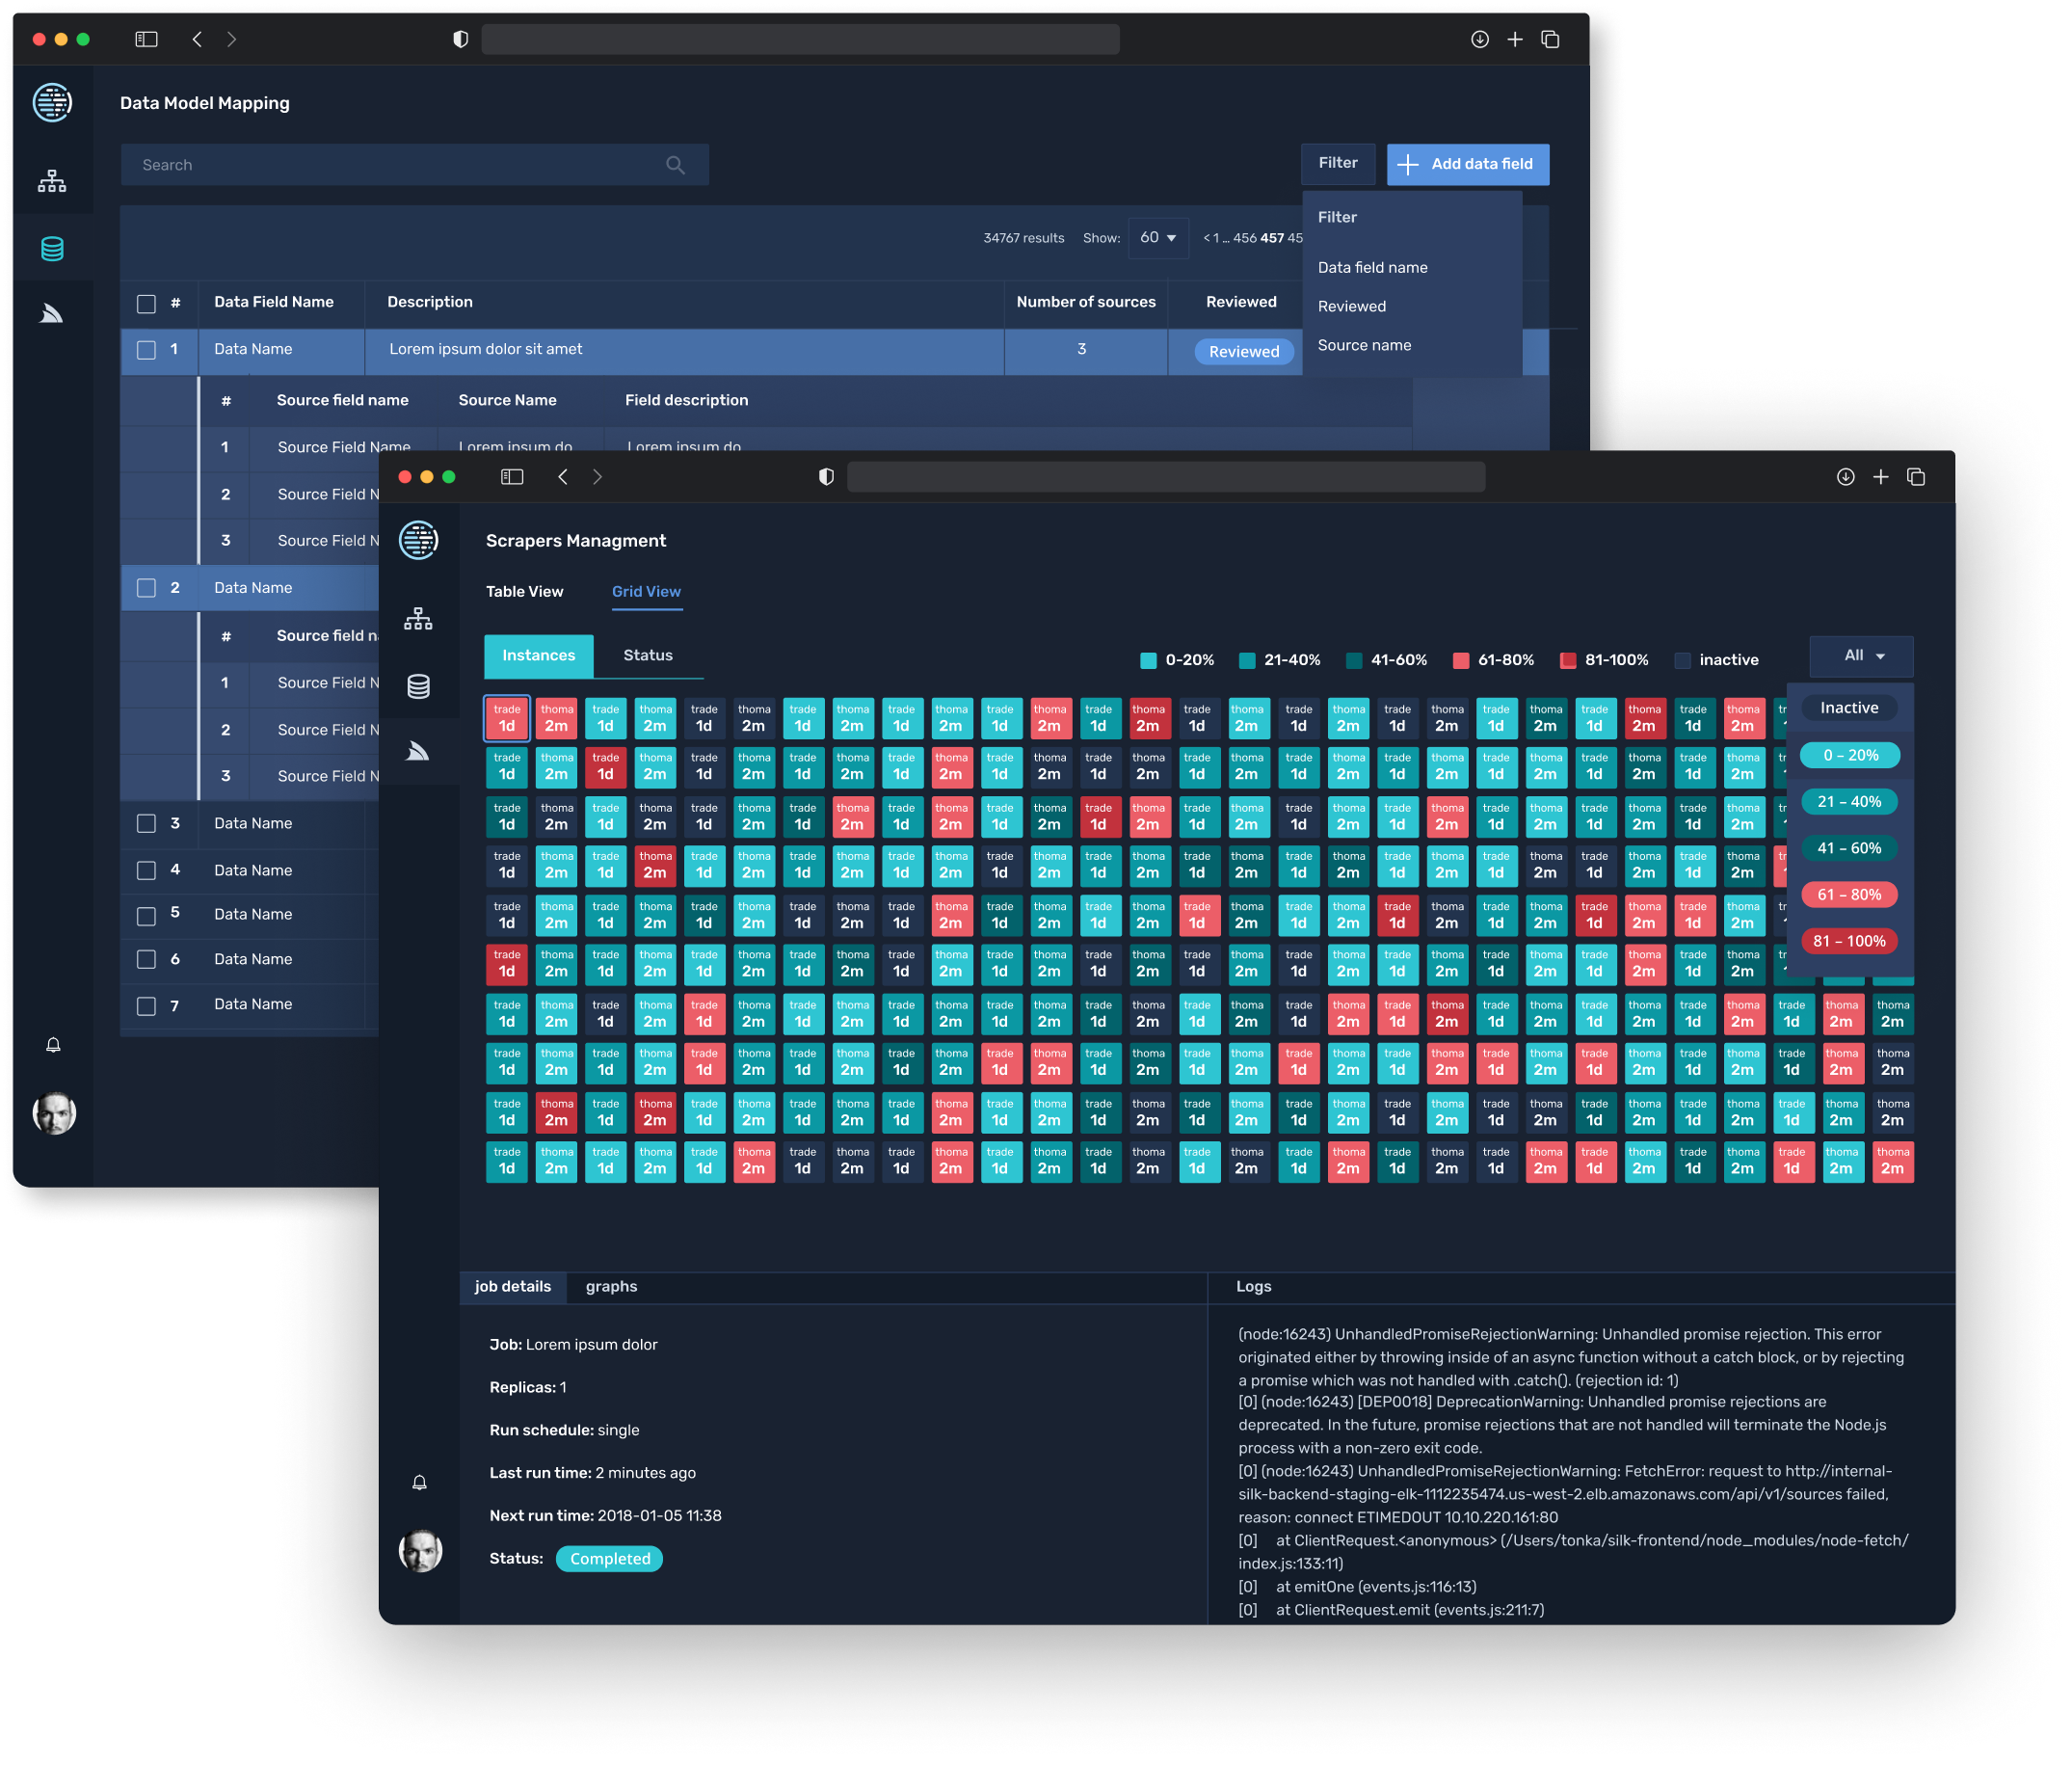
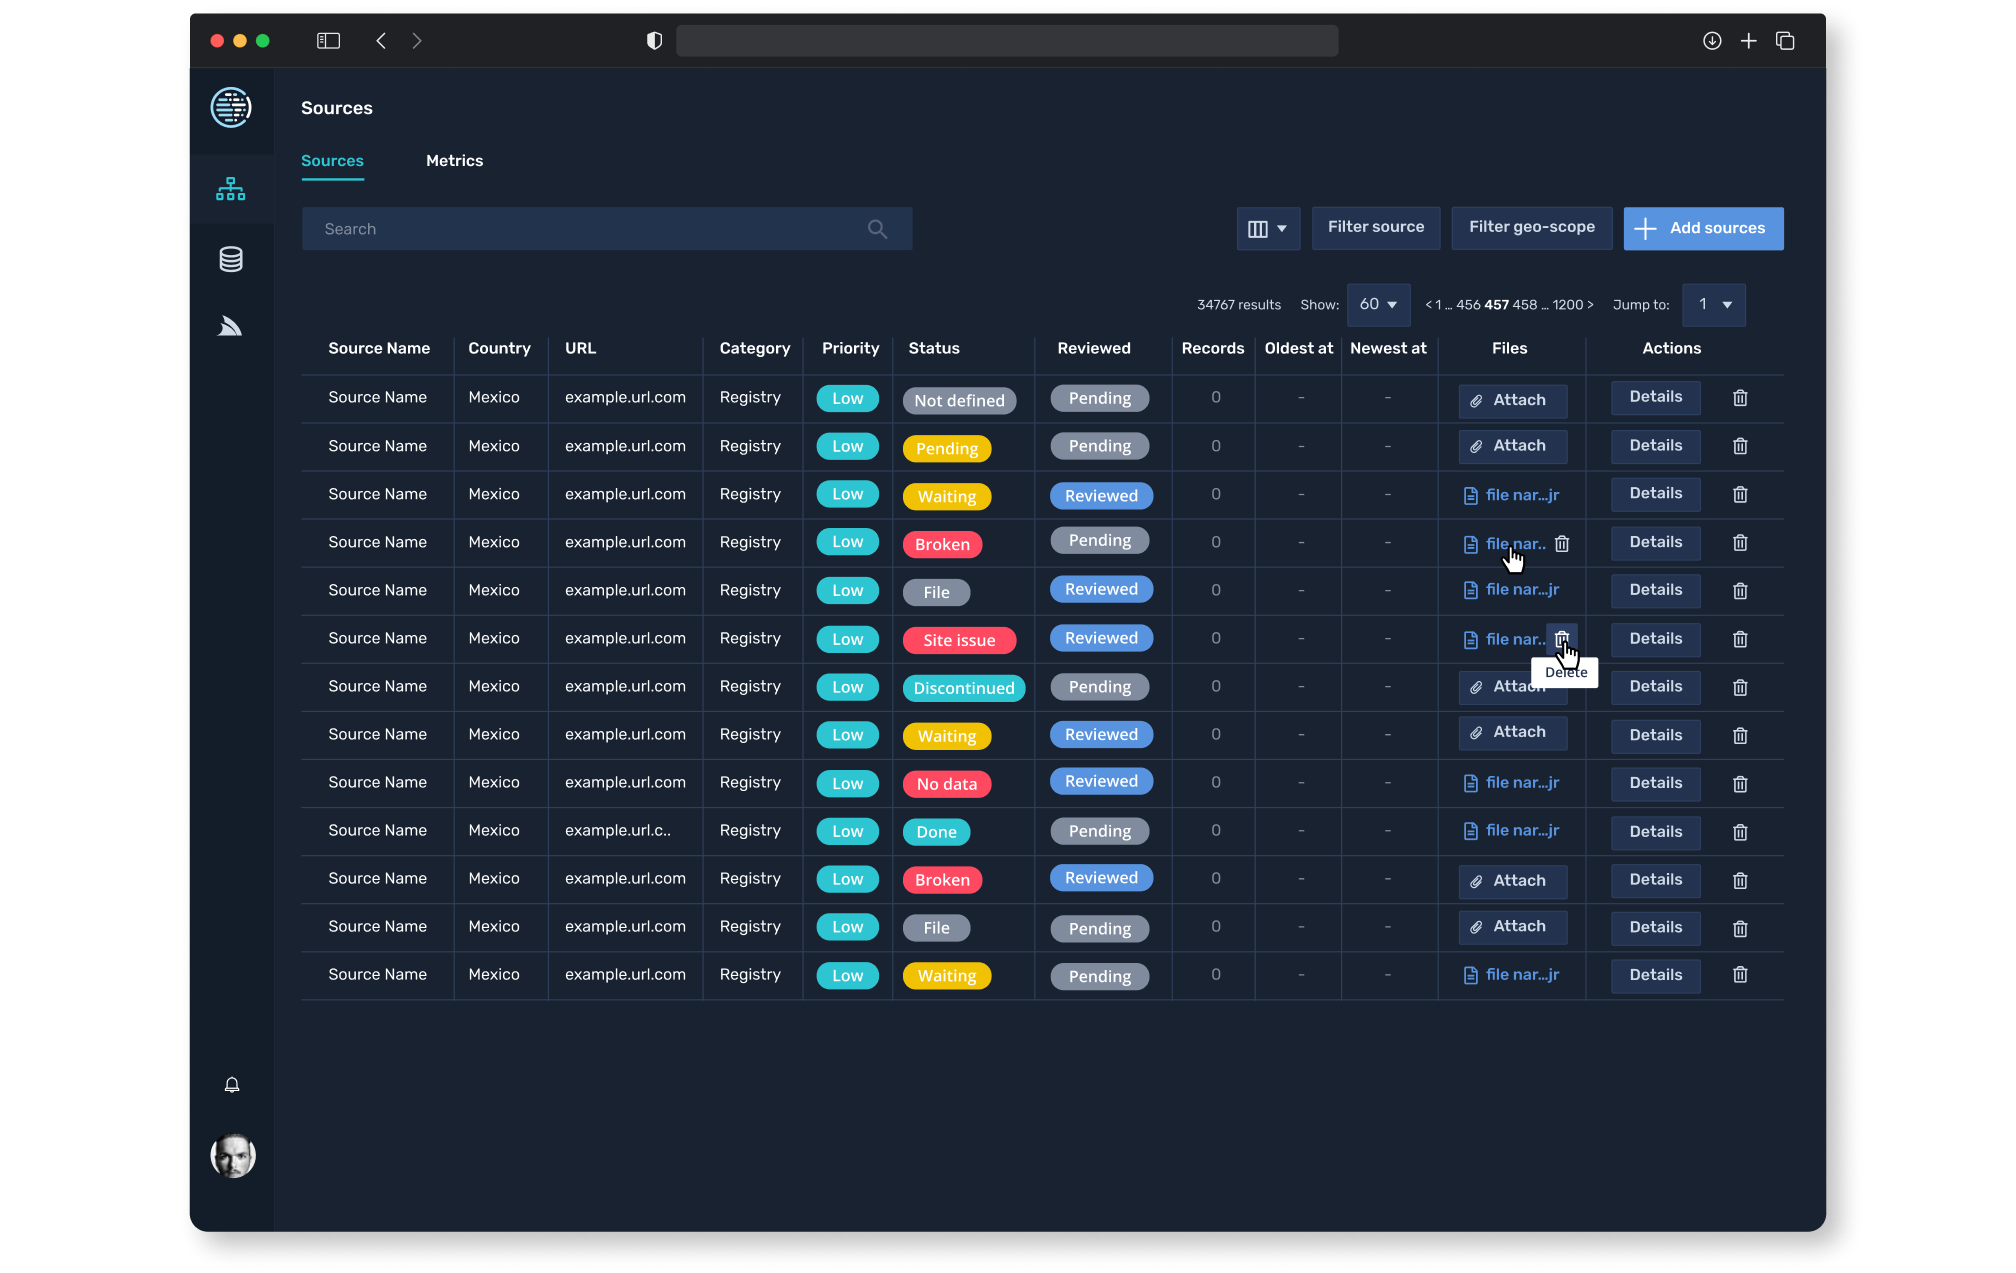
Scrapers are searchable across source type, geographic scope, and status. The search surface has one job: get people to the right process without scrolling past everything else.
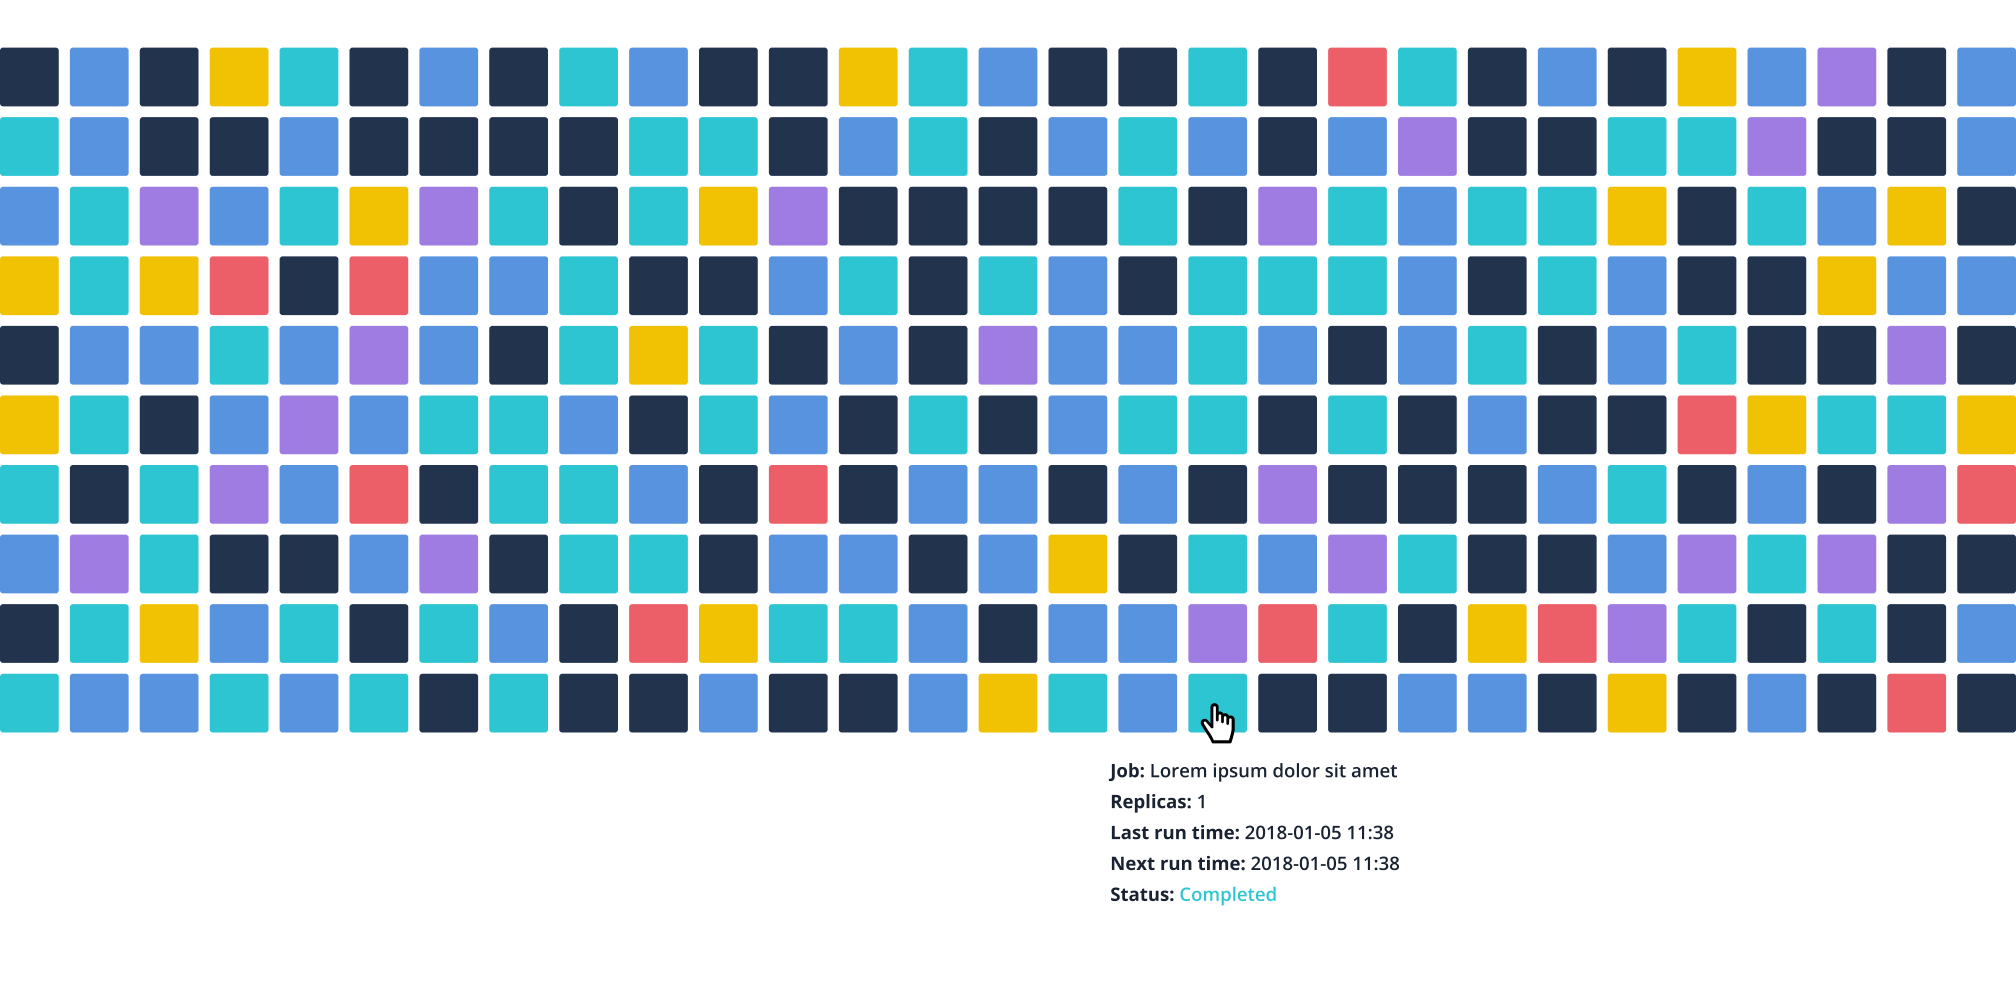
From there the system splits. The Metric View gives analysts a single read on process health across the whole system. The Table and Grid Views give developers sortable, filterable detail, status, run history, failure counts, without a summary layer in the way. One view would have failed both, which is exactly what discovery predicted.
The Job Details and Logs panel is where the decision is most visible. Real replica counts, real run schedules, real stack traces. Developers see what ran, when, and why it broke, with nothing softening the signal. This is the screen that makes two interfaces the right call rather than an indulgence.
Testing
Three changes came straight out watching people use it.
I ran usability sessions with internal developers and analysts. Colour coding and alert states got sharper so scraper status reads at a glance, navigation between views got simpler with icons and a sticky menu, and I added tooltips so analysts could read technical metrics without a developer next to them.
Result
Scraper-by-scraper checking turned into one view across every process.
After Silk shipped, the developer team's read was consistent: monitoring was faster. Problems that used to need individual investigation now surfaced in the dashboard before anyone went looking. Analysts got health visibility without touching developer tooling, developers kept their precision controls without a summary layer in the way, and the overlap that had been slowing both down was gone.
.svg)
.avif)
.avif)